26. PARETO ANALYSIS (Questioning, Discussion, Feedback, Writing)
Description: Pareto Analysis is a simple technique for prioritizing problem-solving. It's based on the Pareto Principle (also known as the 80/20 Rule) – the idea that 80 percent of problems may be caused by as few as 20 percent of causes. Pareto Analysis not only shows the most important problem to solve, it also gives a score showing how severe the problem is.
Application: Use this protocol in all content to identify factors that cause the greatest impact. It can also be used for personal-affect development for students.
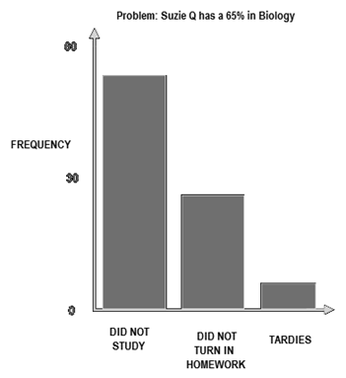
Process: Give students a “problem” that includes numerous possible causes. Ask them to identify and list possible causes. Over a pre-determined period of time, ask students to denote the frequency at which the causes occur, adding up the score for each. Direct the students to create a bar graph showing the distribution of causes on the bottom of the graph and showing the frequency on the left. Ask students to create the graph, having the cause with the greatest frequency to the left, then the next greatest, then the next, etc. From this point, tell students to identify the greatest cause and list possible solutions.
http://www.mindtools.com/pages/article/newTED_01.html
Description: Pareto Analysis is a simple technique for prioritizing problem-solving. It's based on the Pareto Principle (also known as the 80/20 Rule) – the idea that 80 percent of problems may be caused by as few as 20 percent of causes. Pareto Analysis not only shows the most important problem to solve, it also gives a score showing how severe the problem is.
Application: Use this protocol in all content to identify factors that cause the greatest impact. It can also be used for personal-affect development for students.
Process: Give students a “problem” that includes numerous possible causes. Ask them to identify and list possible causes. Over a pre-determined period of time, ask students to denote the frequency at which the causes occur, adding up the score for each. Direct the students to create a bar graph showing the distribution of causes on the bottom of the graph and showing the frequency on the left. Ask students to create the graph, having the cause with the greatest frequency to the left, then the next greatest, then the next, etc. From this point, tell students to identify the greatest cause and list possible solutions.
http://www.mindtools.com/pages/article/newTED_01.html
Reference, and/or for more information
26. Pareto Analysis
http://www.mindtools.com/pages/article/newTED_01.htm
26. Pareto Analysis
http://www.mindtools.com/pages/article/newTED_01.htm
